sensor_dev
The sensor development team's repo.
Sensor Development, Spring 2018
Lois Lee, Srilekha Vangavolu, Hannah Si
May 18, 2018
Abstract
The goal of the Sensor Development subteam is to create sensors that monitor water quality during the water treatment process. The subteam has previously developed particle concentration and turbidity sensors, including a fluidized bed solids detector for in-lab experiments conducted in piping. This semester, the subteam is designing a submersible solids detector for measuring turbidity and sludge blanket height in sedimentation tanks. The aim is to create a turbidimeter and sludge blanket height detector that is more affordable, easier to fabricate, and more usable than those currently used in the field. Two designs involving an endoscope and photodiode, respectively, are being compared for accuracy and usability.
Introduction
The Sensor Development subteam creates sensors to monitor water quality in various stages of the AguaClara wastewater and drinking water treatment processes, for purposes not limited to facilitating research, gauging the efficacy of the treatment process, and detecting problems in the treatment process. The subteam’s first project was to develop a gas measurement sensor that would improve experimentation in the Anaerobic Fluidized Bed (AFB) Reactor and Upflow Anaerobic Sludge Blanket (UASB) wastewater subteams (Fall 2016 report). Afterward, the subteam worked on a fluidized bed solids concentration sensor to measure clay particle concentration in the high rate sedimentation (HRS) process for drinking water treatment. Last semester’s team refined the fluidized bed solids concentration sensor, finishing with a working and reliable sensor (Fall 2017 report). This semester, the subteam is building a submersible solids concentration sensor to measure turbidity and the height of the sludge blanket in the sedimentation tanks of drinking water treatment plants.
This semester, the Sensor Development subteam is implementing two new designs for a submersible solids concentration, or turbidity sensor based on the two ideas recommended by our advisor and by other AguaClara members. The primary design features an endoscope and visual processing in a mobile application, providing an intuitive and appealing user interface. In the second design, a pre-developed analog turbidity sensor is interfaced with a microcontroller, a system that is easier and cheaper to implement but provides a difficult user interface. The end goal of both designs is to provide the treatment plant operators and members of other subteams with a more affordable, easily used and maintained, and instantaneous method of not only determining the height of the sludge blanket, but also measuring the turbidity of the sedimentation tank fluid at varying depths.
Manual
Product Details
Mobile Application-Processed Endoscope (MAPE) Turbidity Sensor
The mobile application-processed endoscope turbidity sensor encompasses three main physical components: 1) the endoscope, 2) an expandable ruler system, and 3) a mobile device, such as a smartphone, provided by the user. The sensor system also contains one software component: a mobile application (on the mobile device), that processes and displays data from the endoscope and interacts with the user.
-
Endoscope
An endoscope is a type of borescope, an optical instrument that is typically slender, illuminated by built in lights, and attached to a long cable, making it suitable for viewing inside otherwise inaccessible places. An endoscope specifically was chosen for this turbidity sensor for its small size, accuracy, water resistance, and device compatibility.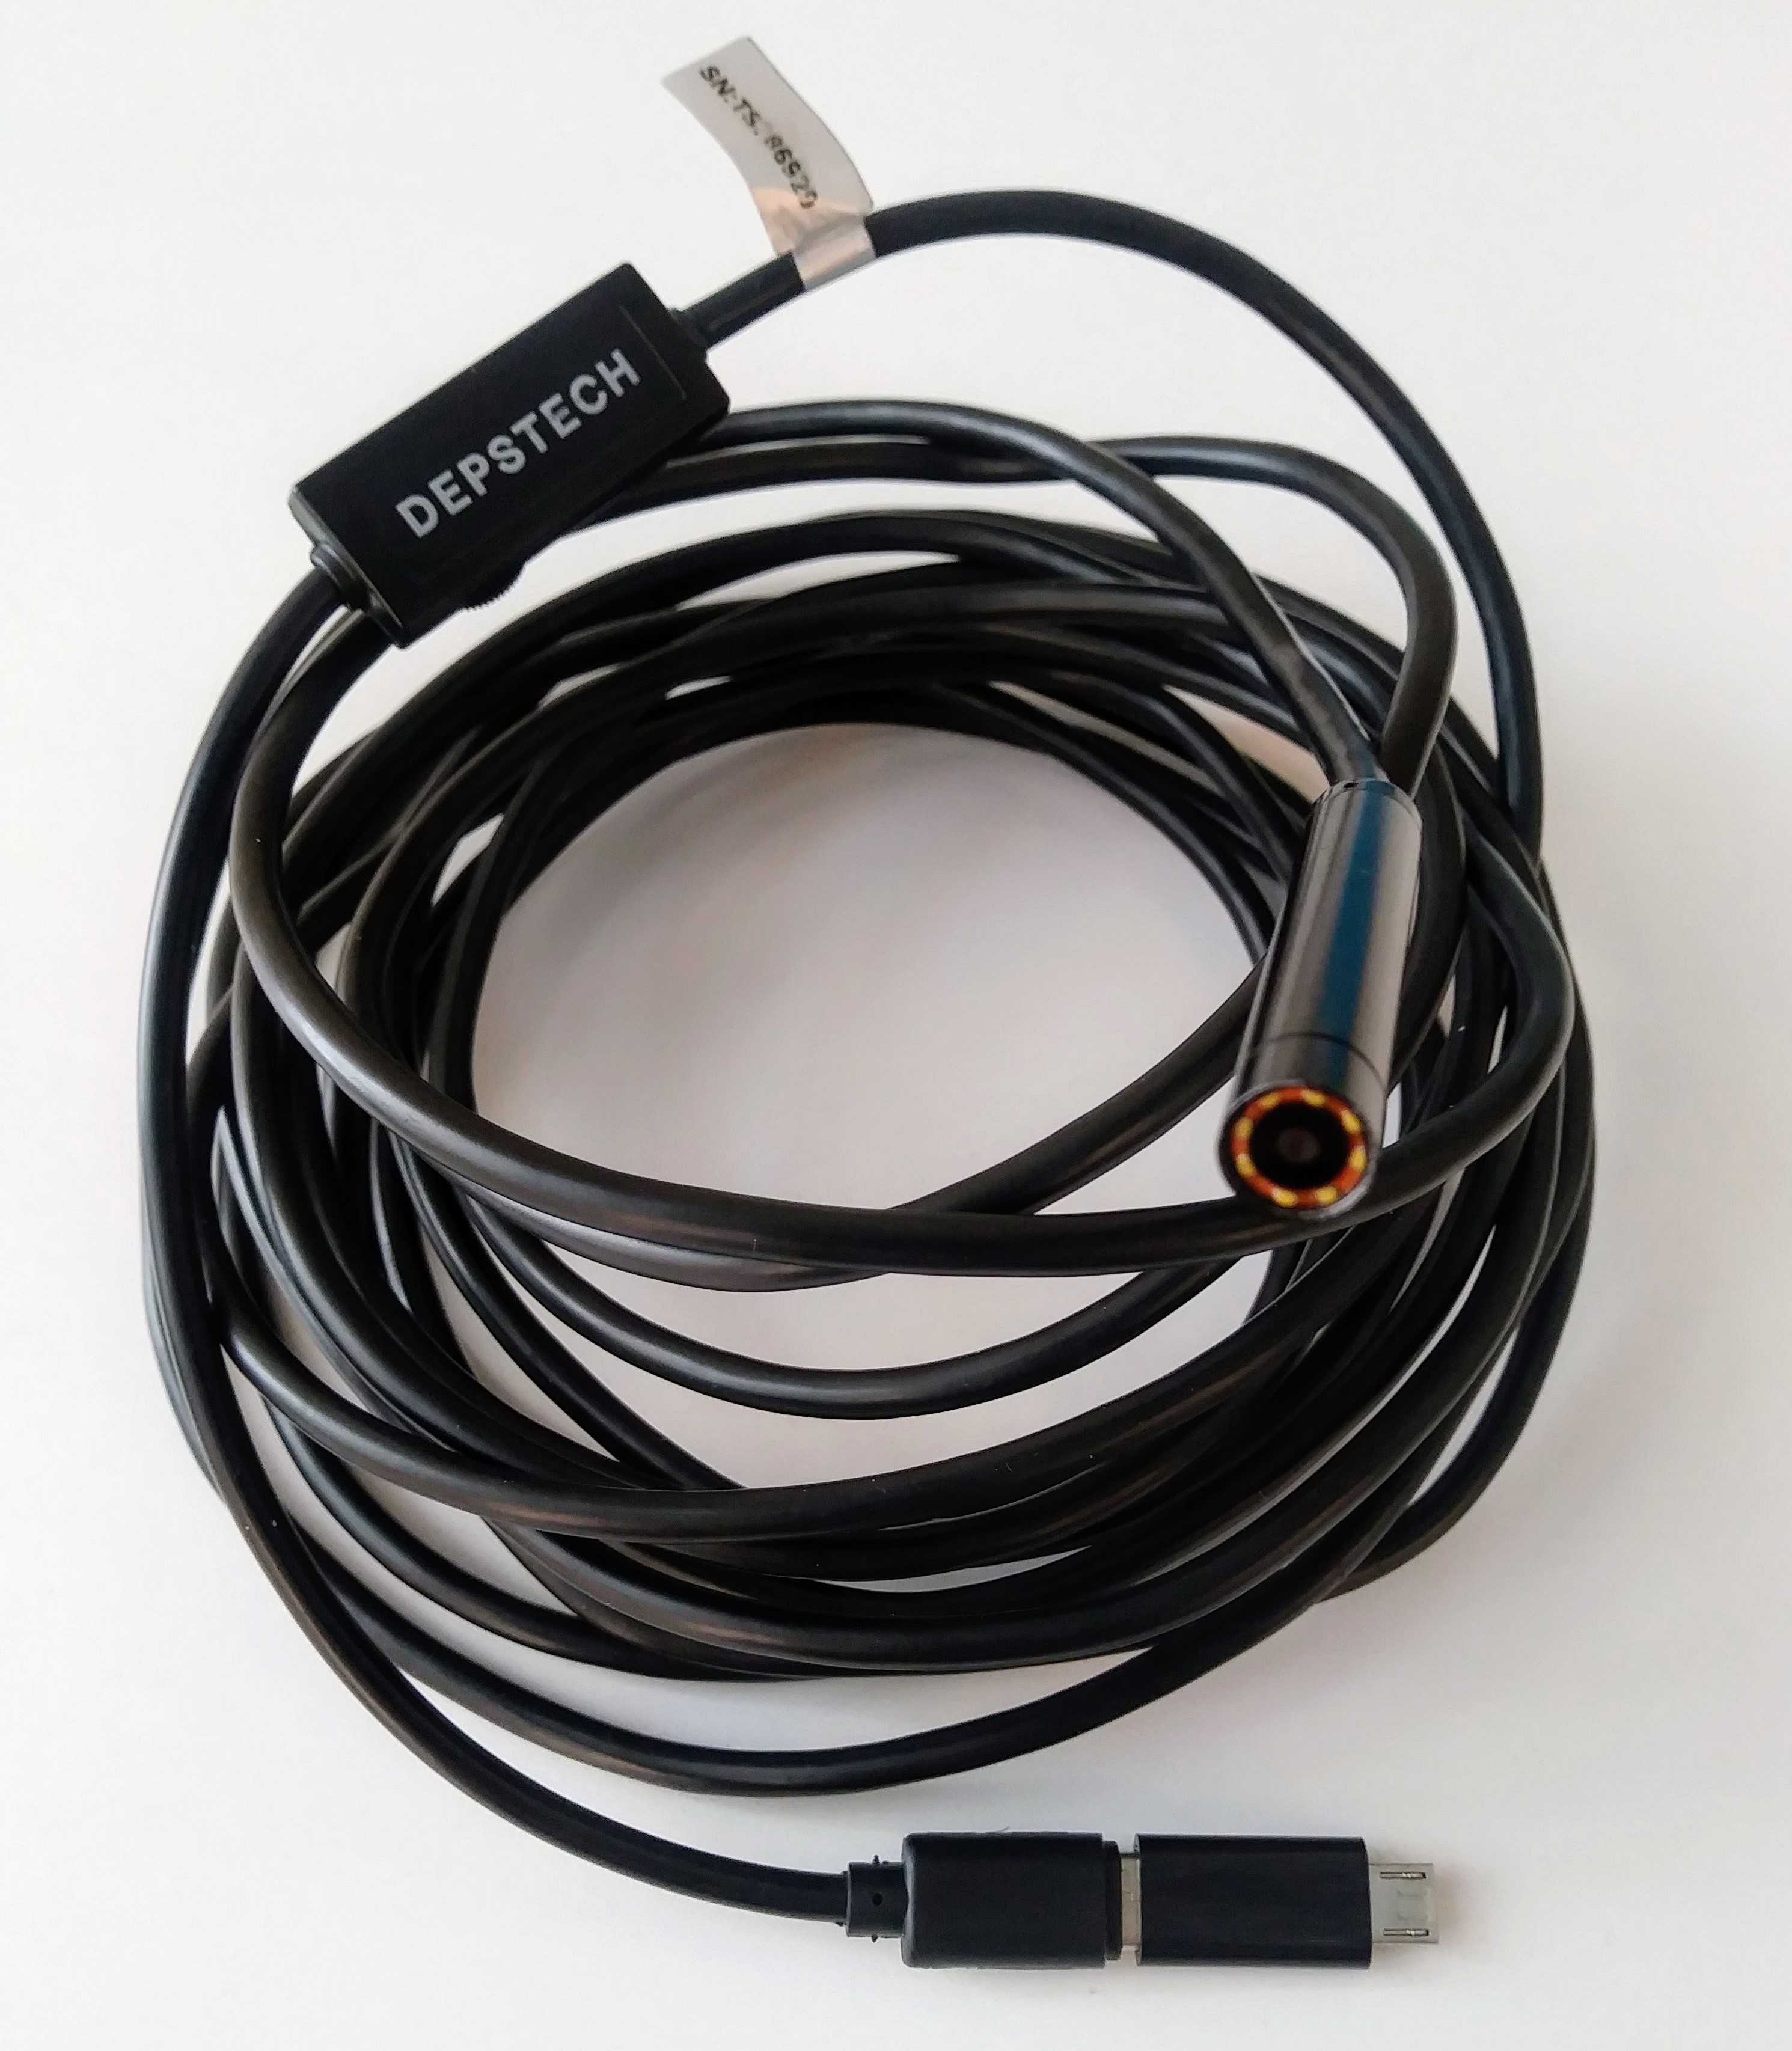 </br>
</br>
Figure 1. This endoscope purchased from Depstech® features a 5 meter-long semirigid cable, a 2.0 MP camera ringed with adjustable LED lights, and a type-c USB end with complementary USB and micro-USB extensions. See Special Components for more details.</br> </br>
The role of the endoscope is to capture images of the sedimentation tank fluid at certain depths. The images will be lit by its light source, a ring of LED lights around the camera lens. To restrict its view to such depths, the endoscope is accompanied by a non-reflective material, such as matte rubber, fixed no more than an inch in front of its lens. The turbidity of the fluid is thus measured by intensity of light reflected back to the endoscope due to the presence of suspended solids. In fluid of low solids concentration, the endoscope should detect minimal reflection of light.
-
Expandable Ruler System
Instead of using a marked reel, we are fabricating an expandable ruler system to measuring the length the endoscope has been lowered by. This system consists of multiple 20 cm long PVC panels marked at each centimeter. The panels are connected by hinges to expand and collapse in an accordion style, while the endoscope cable runs down the side of the panels through a series of loops, folding with the panels (see Figure 2). The width of the panels must be around 2 inches or less in order to fit through the sedimentation tank opening.
Thus, the user may lower the system panel by panel until the endoscope has reached the sludge blanket. The height of the sludge blanket would equal the depth of the endoscope (measured by the panel markings) subtracted from the total height of the sedimentation tank. The advantages of this expandable system are its collapsibility, making it ideal for transport, and the rigid backing it provides so that the endoscope wire, which is semi-rigid, remains perpendicular to the bottom of the tank, ensuring an accurate height reading.
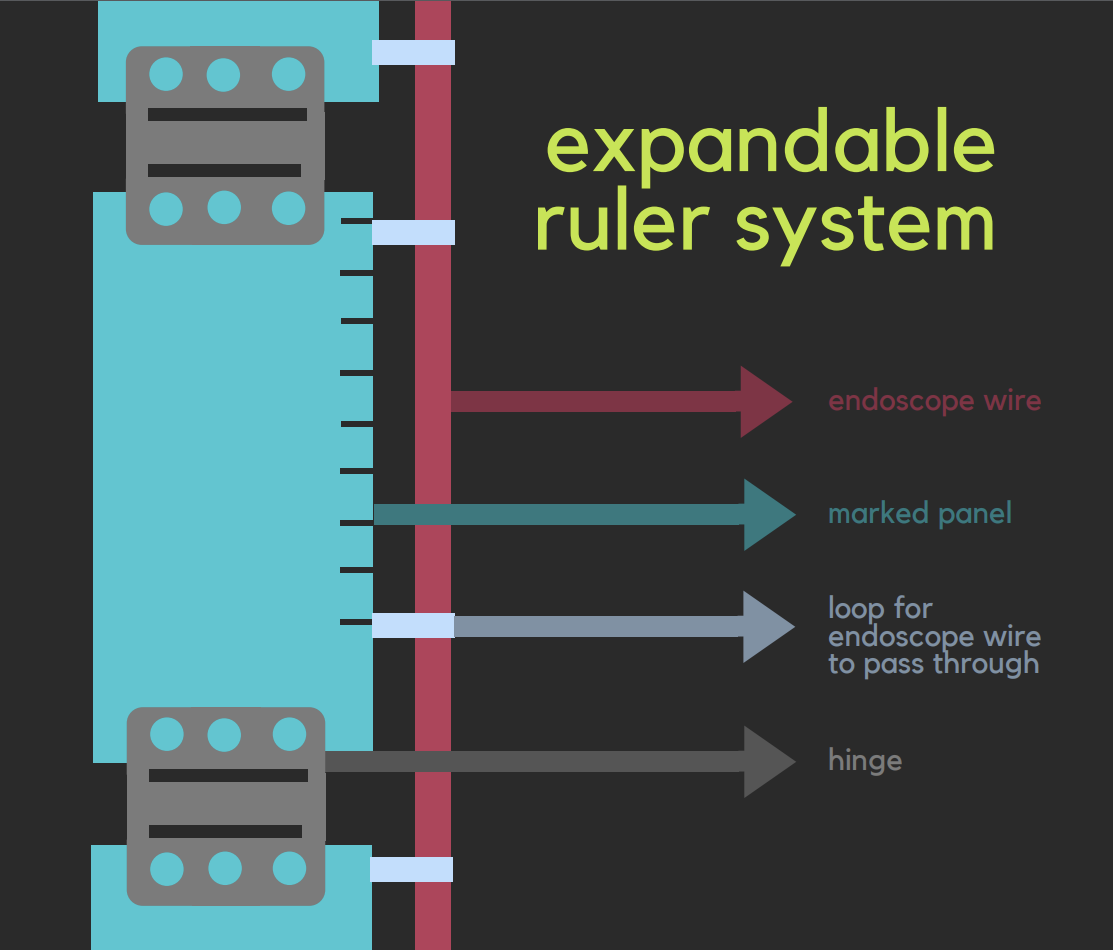
Figure 2. The expandable ruler system consists of multiple marked panels connected by hinges end-to-end. (Only a portion of the entire system is shown.) The endoscope cable runs down the side of the panels through a series of loops. </p>
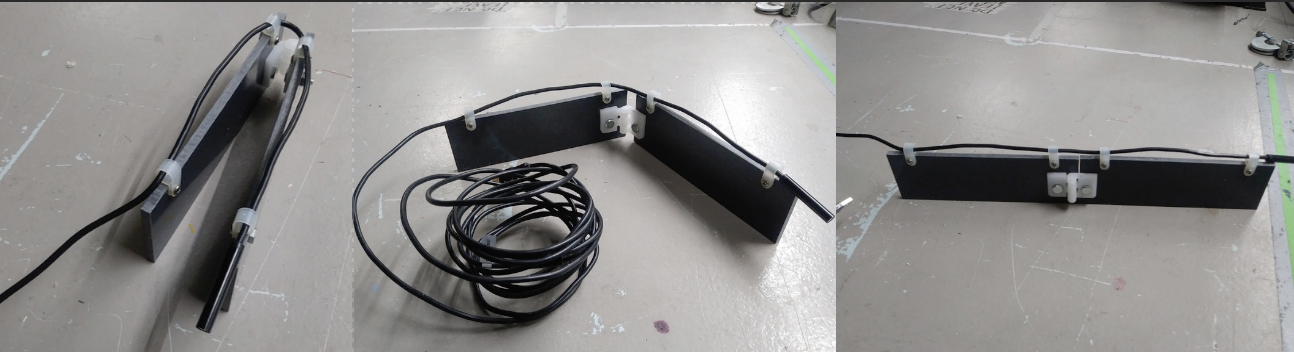
Figure 3. Above is a prototype of the expandable ruler system, constructed with two PVC panels, plastic loops, and plastic hinges. The prototype is able to collapse (left) for compact storage and also expand (right) to provide a straight, rigid backing for the endoscope cord when hung vertically. </br> </br>
-
Mobile Device and Application
The mobile device is a smartphone or tablet computer provided by the user. It connects to the endoscope by a USB-C, USB, or Micro USB connection and runs the mobile application that we are in the process of programming.The application will collect live images taken by the endoscope, process each one for average light intensity, and calculate the turbidity of the fluid in each image. This calculation will use an empirically obtained correlation between turbidity and the intensity of reflected light (yet to be developed), as well as offset for any light detected during calibration in clear fluid. See MAPE Code for sample processing code.
The mobile application will also provide a user-friendly interface by directing the user to calibrate the sensor, prompting the user to lower the endoscope to greater depths, and displaying the camera stream and calculated turbidity at each depth. In addition, it will record and graphically plot each calculation to track the change in turbidity as the endoscope nears the sludge blanket. The height of the sludge blanket can be determined once the turbidity rapidly increases or reaches a threshold value.
Microcontroller-Interfaced Analog (MIA) Sensor
The microcontroller-interfaced analog sensor also encompasses three main physical components: 1) the analog photodiode, 2) an expandable ruler system, and 3) a microcontroller programmed to convert and displays data from the endoscope and interact with the user.
-
Analog Photodiode
We had previously been using an analog turbidity sensor, however because of its unreliability and sensitivity to noise, we were forced to use a photodiode instead. The specific photosensor that we used was the TEMT6000 Ambient Light Sensor. See Special Components for details and image source. </p> -
Expandable Ruler System
This expandable ruler system is the same as that of the MAPES sensor system. We will fabricate it in the same way but the endoscope will be replaced by the photosensor. -
Microcontroller
The microcontroller we are using is the Arduino® UNO. The Arduino will read the output from the analog photosensor and convert that value into a turbidity reading. The developers of the sensor have published a tentative relation; however, further testing must be done to prove the validity of the relation. If the readings do not correlate to accurate turbidity, we may have to empirically develop a relation of our own. The microcontroller will also feature a digital display for the turbidity reading and a pushbutton for calibrating the sensor in clear fluid.See Special Components for details on the Arduino microcontroller and MIA Code for sample code.
Fabrication
Fabrication for the MAPE Turbidity Sensor
The only modification necessary for the endoscope is the addition of an extension for the non-reflective material. The extension includes two rectangular plates, one attached to the endoscope body, and the other extending off the endoscope and holding the non-reflective material in front of the camera lens. The two plates are screwed to and connected by two standoffs. The former standoff contains a hole the size of the endoscope so that the endoscope may slide through and be fixed to the plate with glue or another sealant.
The optimal distance from the camera lens to the non-reflective material is determined as the lowest distance for which the material reflects an acceptably low amount of light (with “acceptable” defined as reflecting light almost uniformly rather than in a bright spot or halo). Note that minimizing the distance minimizes the size and diameter of the sensor. For our endoscope and with matte rubber as the non-reflective material, we estimate a distance of 1.5 cm. Using the distance ($D$) and the field of view ($\theta$) angle of the endoscope (60º for ours), the minimum width ($W$) of the non-reflective material and the plates is:
$W = D \cdot 2tan(\frac{\theta}{2}) = 1.5 \cdot \frac{2}{\sqrt{3}} ≈ 1.732 cm$
All parts can be made of plastic or metal, except the non-reflective material, for which we suggest matte rubber. Below is a rendering of the extension.
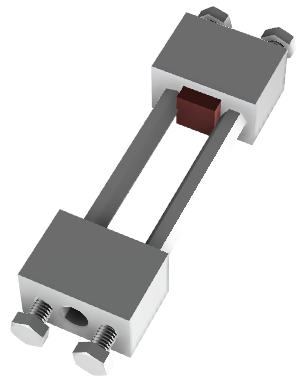 </br>
</br>
Figure 5. The extension includes two rectangular plates, one attached to the endoscope body, and the other extending off the endoscope and holding the non-reflective material in front of the camera lens. The two plates are screwed to and connected by two standoffs. Find the Fusion 360™ file for the extension here. </br> </br>
Variables </br> </br><p align="center">Table 1: List of Variables Used in MAPE Sensor Fusion Drawing | Variables | Description | Value | |:————— |:———-:| ——– | | rec_width | width of plate | 2 cm | | rec_length | length of plate | 3.5 cm | | standoff_diam | diameter of standoffs | .7 cm | | rec_thickness | thickness of metal plates | 3 cm | | endoscope_diam | diameter of endoscope | 5/16 in | | screw_diam | diameter of threads | 5/32 in | | disttoedge | distance from screw to edge of plate | .05 cm | | screw_leng | length of threads | .6 cm | | screw_poly | diameter of hex screw head rubber | .7 cm | | chamfer | length of chamfer at bottom of screw | .6 cm | | fillet | length of fillet beneath head of screw | .6 cm |
Fabrication for the MIA Turbidity Sensor
The main fabrication required for the MIA turbidity sensor is waterproofing the circuitry. The wires are hidden in flexible tubing which is thick enough to make sure that no water will enter and damage the sensor. We are still experimenting with ways to waterproof the photosensor however, because we do not want to damage the circuitry. The LED should be easily waterproofed with some silicon, which we plan to do the following semester.
We plan to fabricate a case for the microcontroller for protection and easy handling and for holding the digital display. It will also include a rubber button connected to a pushbutton on the microcontroller to allow the user to calibrate the sensor. The design for the case not yet been finalized.
Fabrication for the Expandable Ruler System </br> As mentioned before, the Expandable Ruler System is made up of multiple 20 cm long PVC panels marked at each centimeter. Each of the panels are connected by double hinges to expand and collapse. The endoscope cable runs down the side of the panels through a series of loops which we attach to the side of the PVC panel (see Figure 2). Although we used single hinges for the prototype (see Special Components), we plan to use a double hinge in future iterations. Please refer to Figure 3 for the prototype.
Special Components
MAPES Turbidity Sensor
Endoscope/ Borescope: </br> The endoscope we used was purchased through Amazon and was developed by Depstech®. Click here to view. Product specifications can be found on the given website as well. Although we chose this particular endoscope, there are other similarly viable endoscopes and borescopes available.
MIA Turbidity Sensor
Analog Turbidity sensor </br> The specific photosensor used was the TEMT6000 Ambient Light Sensor made by SparkFun. TEMT6000 is a silicon NPN epitaxial planar photo-transistor in a miniature transparent mold for surface mounting onto a printed circuit board. The device is sensitive to wavelengths from 390 nm to 700 nm. It is available here. Arduino® UNO </br> The Arduino UNO can be purchased through the Arduino website. The Arduino IDE is also available here for free.
Expandable Ruler System
Hinges </br> The plastic hinges used in the prototype can be found here.
Experimental Methods
Current Experimental Methods
Because we are still in the fabrication and programming process, we are not able to test at this time. However, we are intermittently checking to see if the analog photosensor for the MIA turbidity work correctly. We do this by using print statements and checking to see that there is ample fluctuation and a significant difference between high and low turbidities.
int ledPin = 13;          //declaration for LED
int button = 11;          //digital input of the pushbutton
int offset = 0;           //set the offset as zero for now
int turb_input = A1;      //input in A0 from sensor
int flag = 0;             //if flag is 1, start loop

void setup() {
  // put your setup code here, to run once:
  Serial.begin(9600);
}

void loop() {
  // put your main code here, to run repeatedly:
  int test=analogRead(turb_input);
  Serial.println('\n');
  Serial.println("reading from the input");
  Serial.println(test);

}
Future Experimental Methods
To test our sensors, we will submerge each into fluids of known solids concentration and turbidity. We will then analyze collected outputs for a relation between actual concentration and measured turbidity. It may also be necessary to test the effects of different types, particularly different colors, of sediment on the turbidity readings. However, we are not yet at the testing phase and have no experimentation details yet to report.
MAPE Turbidity Sensor Code
This is a sample of code written in Java for displaying a video stream from the endoscope and processing its images for average light intensity. For the full set of classes required for this program, browse our Github repository at AguaClara/sensor_dev/code/Endoscope Pilot Code (or click here.
/* Framework for video frame capture, conversion, and display adapted from
* http://computervisionandjava.blogspot.com/2013/10/java-opencv-webcam.html
*/

import java.awt.Graphics;
import java.util.Date;

import javax.swing.JFrame;
import javax.swing.JPanel;
import javax.swing.border.EmptyBorder;

import org.opencv.core.Mat;
import org.opencv.imgproc.Imgproc;

public class EndoscopeFrame extends JFrame {
    private JPanel contentPane;
    VideoCap videoCap;

	public static void main(String[] args) {
        try {
            EndoscopeFrame frame = new EndoscopeFrame();
            frame.setVisible(true);
        } catch (Exception e) {
            e.printStackTrace();
        }
	}

	public EndoscopeFrame() {
        setDefaultCloseOperation(JFrame.EXIT_ON_CLOSE);
        setBounds(0, 0, 1280, 960);
        contentPane = new JPanel();
        contentPane.setBorder(new EmptyBorder(5, 5, 5, 5));
        setContentPane(contentPane);
        contentPane.setLayout(null);

        videoCap = new VideoCap(1);
        //0 or nothing for default camera (for a computer, the webcam)
        //1 or higher for additional cameras (e.g. the USB endoscope camera)

        new MyThread().start();
    }

    public void paint(Graphics g){
        g = contentPane.getGraphics();
        g.drawImage(videoCap.getOneImgFrame(), 0, 0, this);

        if (counter % 10 == 0)
          System.out.println("Average Light: " + averageLight(videoCap.mat2Img.mat, 10));
    }

    public static int averageLight(Mat mat, int spacing) {
    		Imgproc.cvtColor(mat, mat, Imgproc.COLOR_BGR2GRAY);
    		int[][] pixelShades = new int[mat.rows()/spacing+1][mat.cols()/spacing+1];
    		int sum = 0;

    		for (int r = 0; r < mat.rows(); r += spacing) {
    			for (int c = 0; c < mat.cols(); c += spacing) {
    				pixelShades[r/spacing][c/spacing] = (int) mat.get(r, c)[0];

    				sum += pixelShades[r/spacing][c/spacing];
    			}
    		}

    		return sum/pixelShades.length/pixelShades[0].length;
    }

    class MyThread extends Thread{
        @Override
        public void run() {
            while (true) {
                repaint();
                try { Thread.sleep(30);
                } catch (InterruptedException e) { }
            }
        }
    }
}
Sample Output:
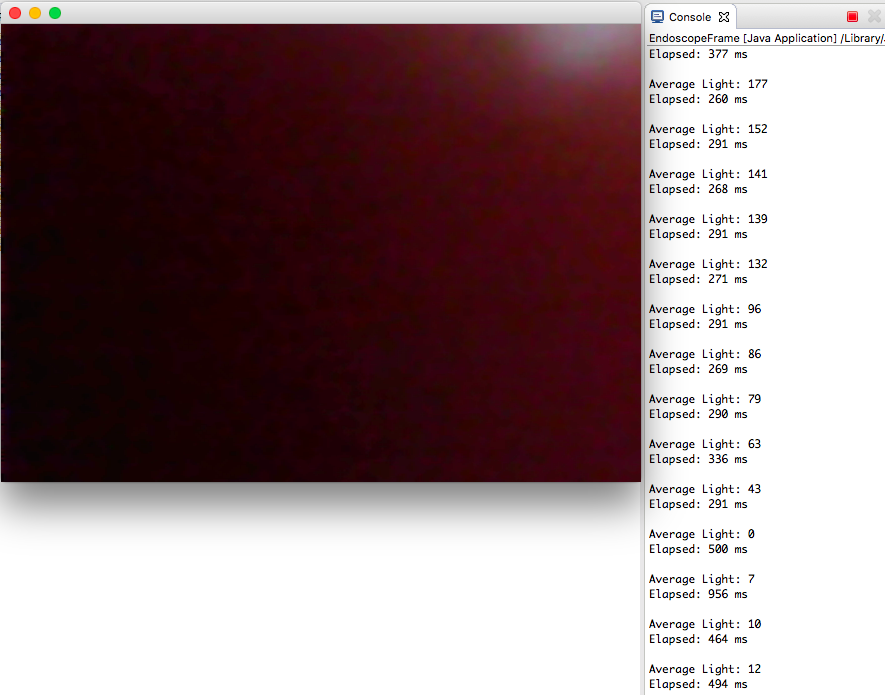
Figure 7. Above is a sample output of the program for the MAPE turbidity sensor produced by exposing the camera to light and then quickly covering it. Hence, the “Average Light” values that fall from near 200 to 0. Additional code was written for printing elapsed time between calculations. </p>
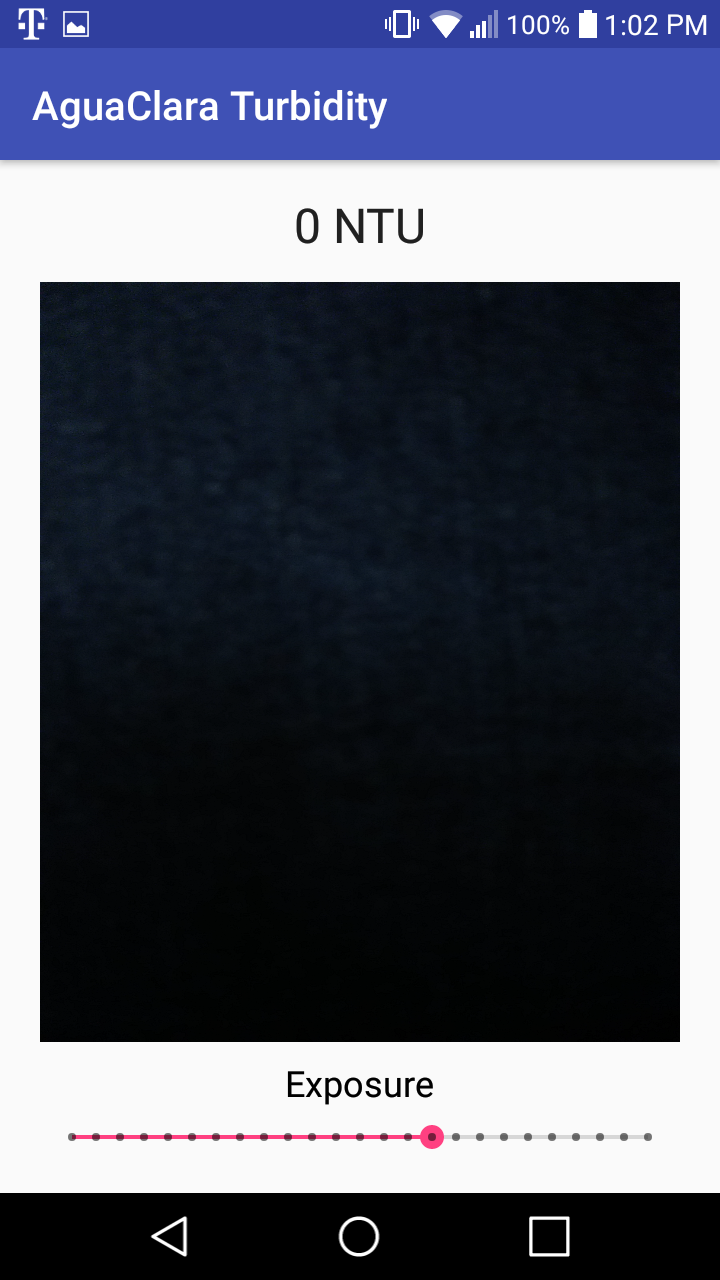
Below is a Java file for a mobile Android application that streams camera feedback from the phone’s own camera(s) with constant exposure. For future work, the application must access the endoscope, an external camera to the smartphone, and integrate the image processing code from above. For the full project, written in Android Studio® using Android libraries, browse our Github repository at AguaClara/sensor_dev/code/AguaClara Turbidity (or click here).
package me.aguaclaraturbidity;

import android.content.pm.PackageManager;
import android.support.v4.app.ActivityCompat;
import android.support.v4.content.ContextCompat;
import android.support.v7.app.AppCompatActivity;
import android.os.Bundle;

import android.util.Log;
import android.view.SurfaceHolder;
import android.view.SurfaceView;
import android.hardware.Camera;
import android.widget.SeekBar;
import android.widget.TextView;

import java.io.IOException;

public class MainActivity extends AppCompatActivity implements SurfaceHolder.Callback, Camera.PreviewCallback {
    private Camera camera;
    private Camera.Parameters camParams;

    @Override
    public void onCreate(Bundle savedInstanceState) {
        super.onCreate(savedInstanceState);

        setContentView(R.layout.activity_main);
        SurfaceView cameraPreview = (SurfaceView) findViewById(R.id.camera_preview);

        ActivityCompat.requestPermissions(this, new String[]{android.Manifest.permission.CAMERA}, 50);

        if (ContextCompat.checkSelfPermission(getApplicationContext(), android.Manifest.permission.CAMERA)
        == PackageManager.PERMISSION_GRANTED) {
            openCamera(0);
            try {
                cameraPreview.getHolder().addCallback(this);
                camera.setPreviewDisplay(cameraPreview.getHolder());
                camera.setPreviewCallback(this);
                camera.startPreview();
            } catch (IOException e) {
                e.printStackTrace();
            }
        }
    }

    public void openCamera(int id){
        releaseCameraAndPreview();
        camera = Camera.open(id);
        camera.setDisplayOrientation(90);
        camParams = camera.getParameters();
    }

    private void releaseCameraAndPreview() {
        if (camera != null) {
            camera.stopPreview();
            camera.release();
            camera = null;
        }
    }

    @Override
    public void surfaceCreated(SurfaceHolder surfaceHolder) {
        try {
            camera.setPreviewDisplay(surfaceHolder);
            camera.startPreview();
        } catch (IOException e) {
            Log.d("View", "Error setting camera preview: " + e.getMessage());
        }
    }

    @Override
    public void surfaceChanged(SurfaceHolder surfaceHolder, int i, int i1, int i2) {
    }

    @Override
    public void surfaceDestroyed(SurfaceHolder surfaceHolder) {
        if (camera != null) {
            camera.stopPreview();
        }
    }

    @Override
    public void onPreviewFrame(byte[] bytes, Camera camera) {
        camParams.setExposureCompensation(0);
        camera.setParameters(camParams);
    }
}