Rapid Mix Design Solution
Create a function to return maximum energy dissipation rate along the centerline of a free jet given inputs of distance downstream of the jet (along the centerline), jet velocity, and initial jet diameter. You will find the Rapid Mix powerpoint useful in finding a relationship between these variables.
Use your function to create a graph of the centerline (maximum) energy dissipation rate as a function of distance from jet origin. * Use an initial diameter of DiamJet = 10 cm and a velocity of VelJet = 1 m/s. * Use a range of 7 to 20 jet diameters when creating the graph. * Use units of meters for the x-axis and W/kg for the y-axis. Make sure to label your axes correctly.
Colab worksheet plotting centerline energy dissipation rate
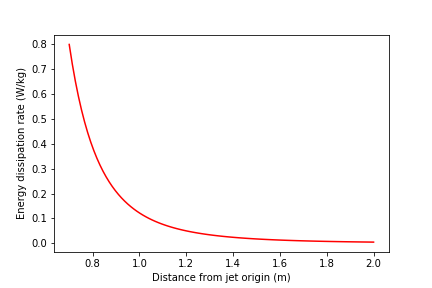
Fig. 95 Energy dissipation rate vs Distance from jet origin